
The SEO Opportunities Report compares the products available on an ecommerce website with what people are searching for on Google. You can use this report for your own retail site or for direct and aspirational competitors to uncover SEO and product copy opportunities. In other words, it helps you identify the gap between what shoppers can find online and what they are actively searching for.
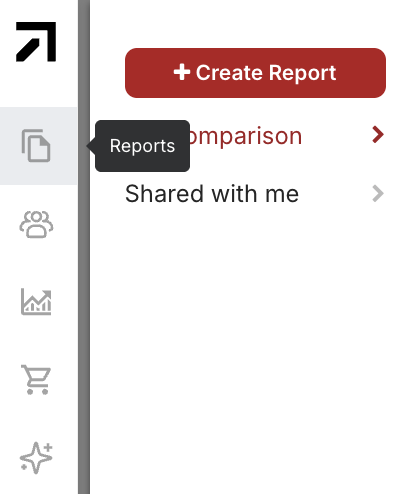
STEP 1: Click the Reports module icon in the left-hand navigation, then click "+ Create Report" and select the SEO Opportunities report.
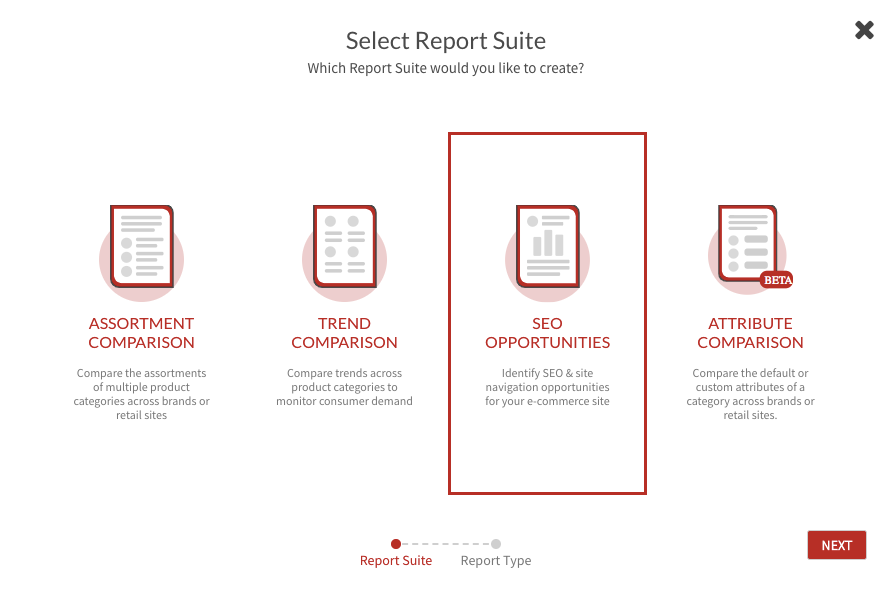
STEP 2: Select one retailer to run the SEO report on, then choose a product category. Add an optional name for the report and click “Submit.”
STEP 3: Analyze the SEO Opportunities Report.
-
Note: To view color count, turn on the Product Count by Style/Color toggle in the top-right corner of the report. When the toggle is on, it will turn green. For example, if a dress style comes in three colors, the count will show as 1 when the toggle is off and 3 when it is on.
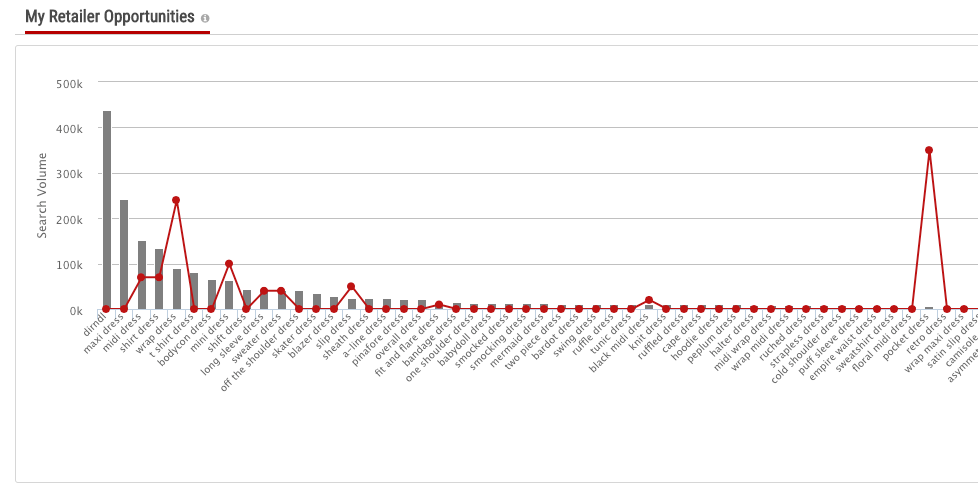
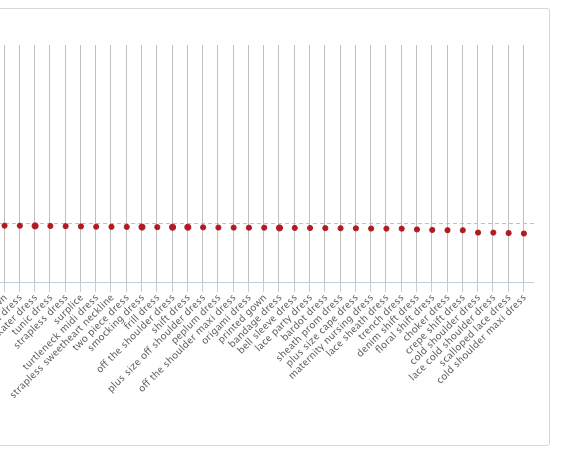
The first chart compares Google search volume for each term with the number of products currently available from the selected retailer. Google search volume is shown in gray bars, while the retailer’s product count is overlaid as a red line. Large gaps between the gray bars and red line can highlight potential white space opportunities. Keep in mind that product counts come from the retailer’s website, while search volume comes from Google—not the retailer’s internal site search.
Product counts are based on whether the term appears in the product name or product copy. If you see a discrepancy, it may mean the product is missing from the assortment, or that it is not being named in the way shoppers are most commonly searching for it.
It is also important to note that you do not necessarily want the graph to appear perfectly balanced. A trend may be over-indexed because it reflects a product the retailer is already known for, regardless of current trend movement. On the other hand, a trend may be under-indexed because it simply may not be the right fit for that customer.
Lastly, a trend may be emerging or declining, which is why this report includes a bubble chart of search growth. This chart highlights the growing and declining trends within the selected category, with the fastest-growing trends shown in green on the left...
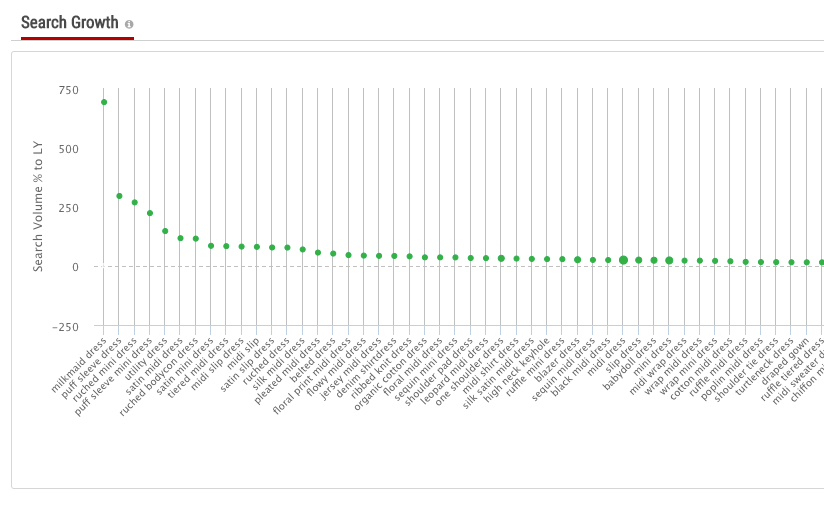
...and the declining trends in red on the right.
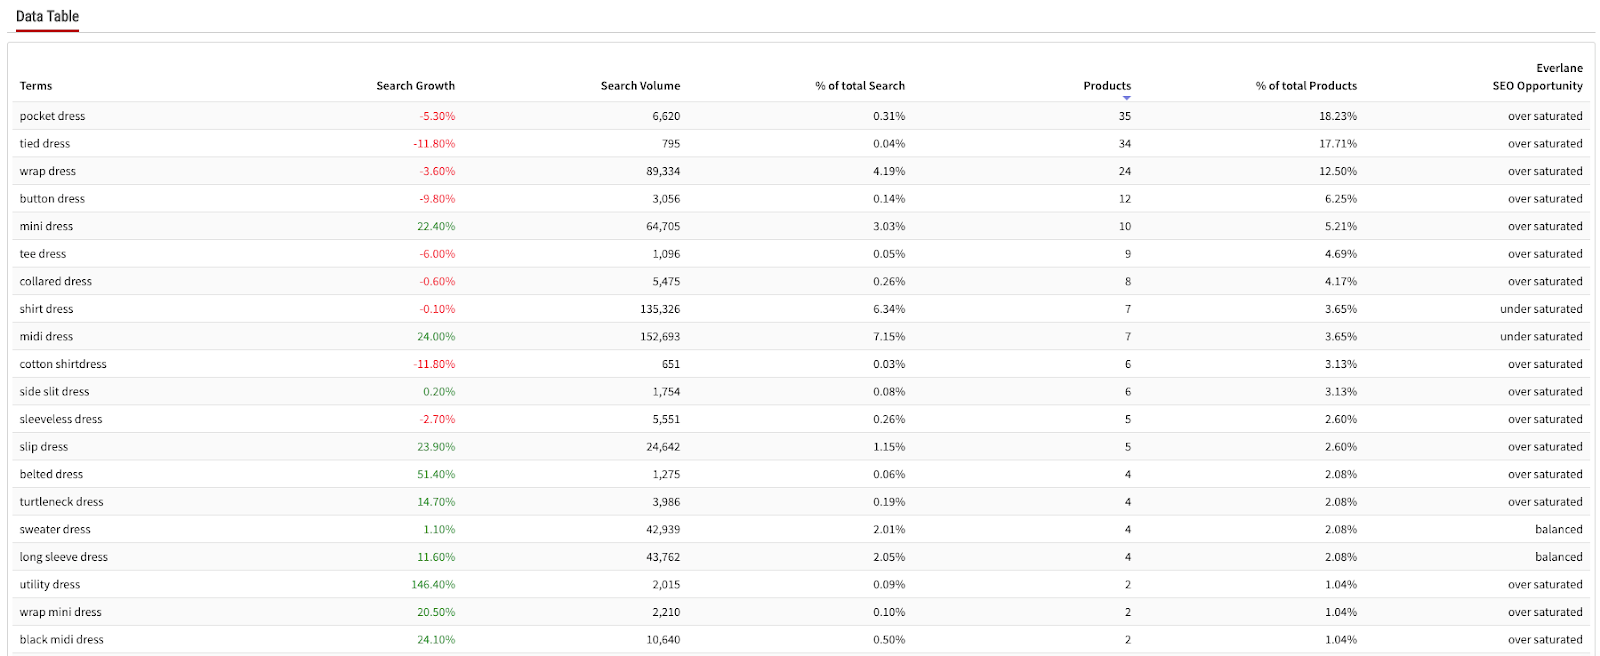
All of the information visualized in the two graphs are also represented in table form. Instead of seeing a visual discrepancy with the bar and line graph above, the table will identify if the trend is under saturated, balanced, or over saturated.
For an in-depth tutorial, be sure to check out our on-demand Trendalytics 101: SEO Opportunities on-demand webinar recording here.