
Reports are a great way of obtaining a high-level overview into different areas of your business. Open up the reports suite by selecting Reports > New Report in your left-hand navigation pane.
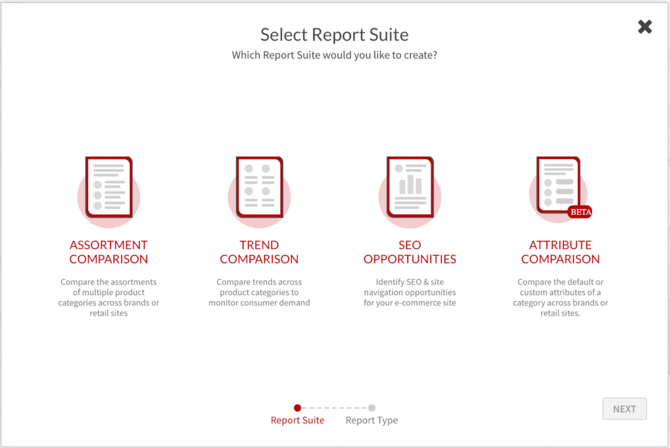
1. Assortment Comparison Report
Quickly compare and identify product assortment, pricing, discount, and product timing opportunities with this report. Our e-commerce data is refreshed weekly, so every time you open a saved Assortment Comparison report you will see the most current data related to your selection.
TL Tip: Incorporate this report into Monday morning business assessments and competitive analysis.
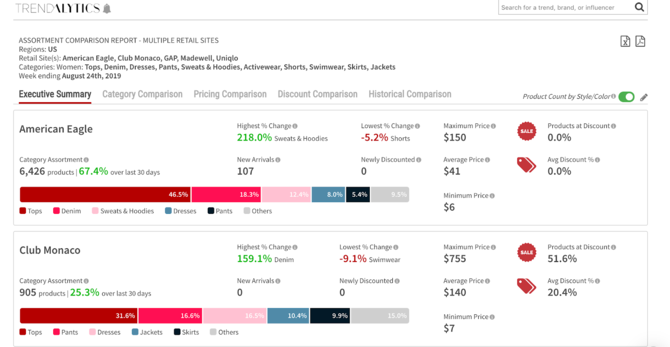
Use the tabs at the top of the report to toggle between various assortment insights, from pricing to category to even historical comparison. Turning on the Style/Color toggle in the top right-hand corner will refresh product counts by the number of color and style options for each product.
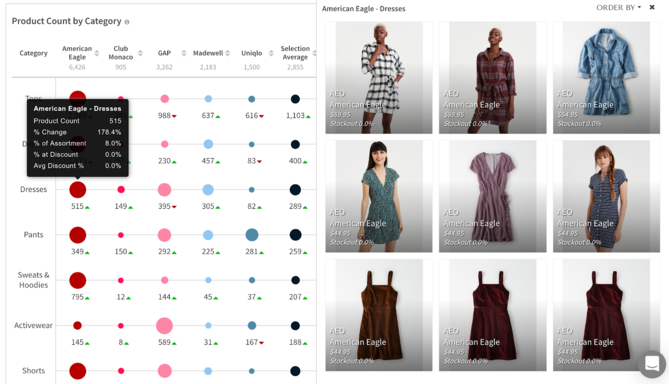
Our reports are dynamic, so clicking into a bubble or bar chart within the report will allow you to quickly and easily comp-shop the product!
Check out our quick video on how to use Reports to dive into pricing, discount, and category comparisons across retailers.
2. Trend Comparison Report
Look at two trend terms side by side, or multiple trend terms, to easily compare data points and reveal insights on consumer demand. For example, you might want insight into which animal print trend is performing best before incorporating one into your assortment.
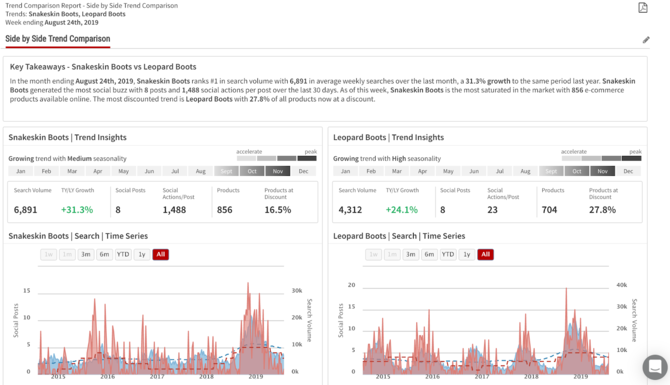
In this example, we've pulled a report comparing snakeskin boots with leopard boots. Here you can look at the same data you'll find within TrendPulse, but all in one easy to visualize and organized place!
As you scroll you will see information from the various parts of our platform including google search data, e-commerce data, and a stream of social media and market images. You may also run a Multiple Comparison Trend Report to analyze up to 10 trends at once.
3. SEO Opportunities Report
Utilize search volume to identify SEO and site navigation opportunities. Select your site and a corresponding category (Ex. Dresses - Silhouette) to compare growing and declining terms.
Based on your selection (either your own retail site or a competitors) and the category you've chosen to analyze, you will see a red line graph showing online product count overlaid with a gray bar graph showing google search volume for each term.
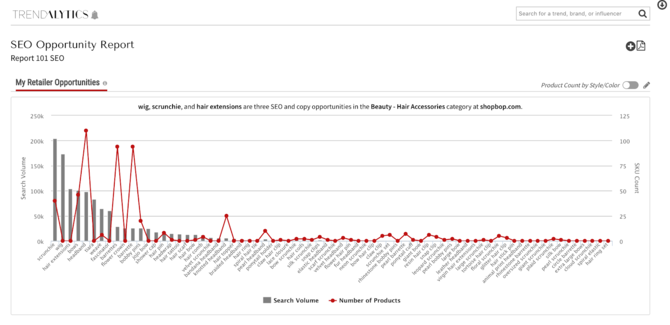
This is a great way of identifying whether you are over or under saturated in a product, opportunities to re-name a product, or opportunity to invest in a growing trend.
Note: Product count is determined by free text within the product name or copy.
4. Attribute Comparison Report
Similar to the Assortment Comparison report, Attribute Comparison allows you to compare pricing and product counts for numerous attributes (Ex. Leopard vs. Zebra) by category (Ex. Swimwear) across multiple brands or retailers.
Select "Default Filters" if you want to quickly see attributes that have been pre-loaded into a custom dictionary including materials, fabrics, prints, and colors. Select "Custom Filters" to utilize the search bar with and/or/exclude capabilities and search for your own custom attributes.
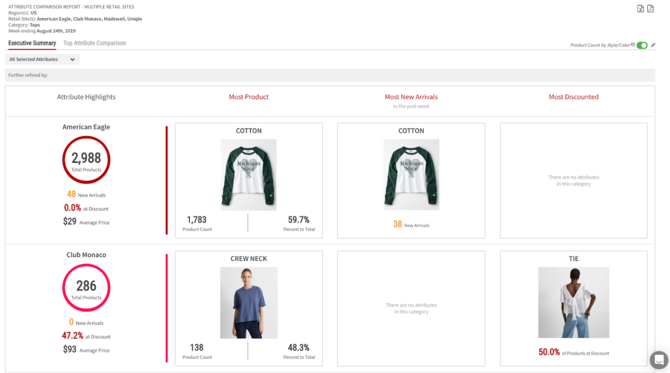
For example, if you're interested in what styles or colors have a high stockout, low discount, and higher average price (which are typically indications of a strong product) you can quickly compare and select various attribute category levels:
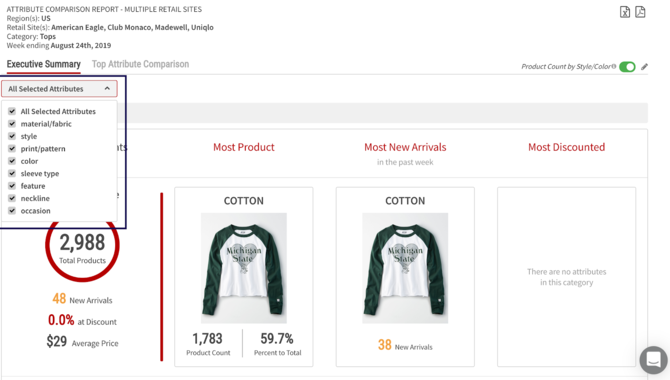
TL Tip: The top 15 attributes will be shown based on your selection. To view all attributes within the dictionary for the category, download the report to Excel via the top right-hand side icon.

We want your feedback! Please contact your Customer Success Manager with any questions and for further insights.