
Here is a quick video to watch step by step how to use BrandPulse to analyze a set of brands or influencer's social data comparatively. Then watch our video on how to analyze an individual Brand or Influencer account by itself.
BrandPulse
BrandPulse helps you compare brands and influencers by social following, growth rate, post engagement, and Google Search popularity. Trendalytics tracks thousands of brands and influencers across TikTok, Instagram, Facebook, and Pinterest, with social data refreshed daily. To get started, click the group icon in the left-hand menu.
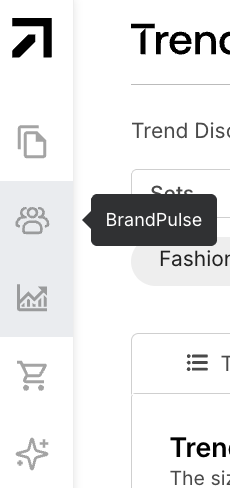
There are two ways to get started in BrandPulse –
1. You can create a BrandPulse set, which is the best way to compare brands and influencers side by side.
Here is a quick tutorial on how to create a BrandPulse set.
-
TL Tip: We recommend starting with the custom view to understand the bigger picture before diving into an individual brand or influencer, as it allows you to easily analyze multiple brands and influencers your target audience is interested in at once.
Once you're in your set, on the Social Overview tab you can view Brands or Influencers in a set compared by Fan Count, Post Engagement, or Social Buzz. You can also view a Social Stream of all their social posts within the selected time frame, sorted by Post Engagement.
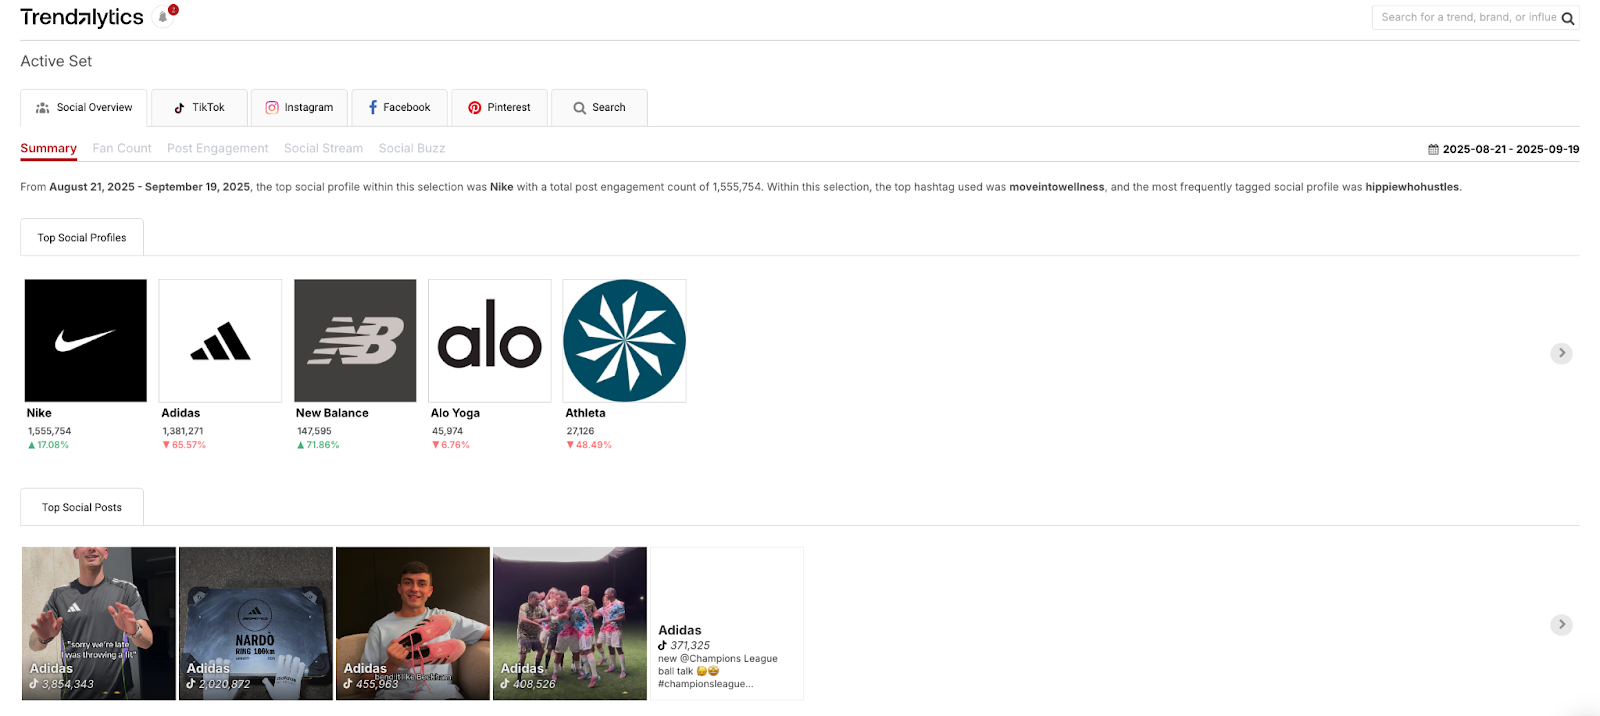
The Summary page breaks down the Top Social Profiles (by post engagement), Top Social Posts (by social actions), Top Mentions, and Top Hashtags across all the profiles in the set.
The other tabs include:
Fan Count: fan count or followers aggregated across TikTok, Instagram, Facebook, and Pinterest
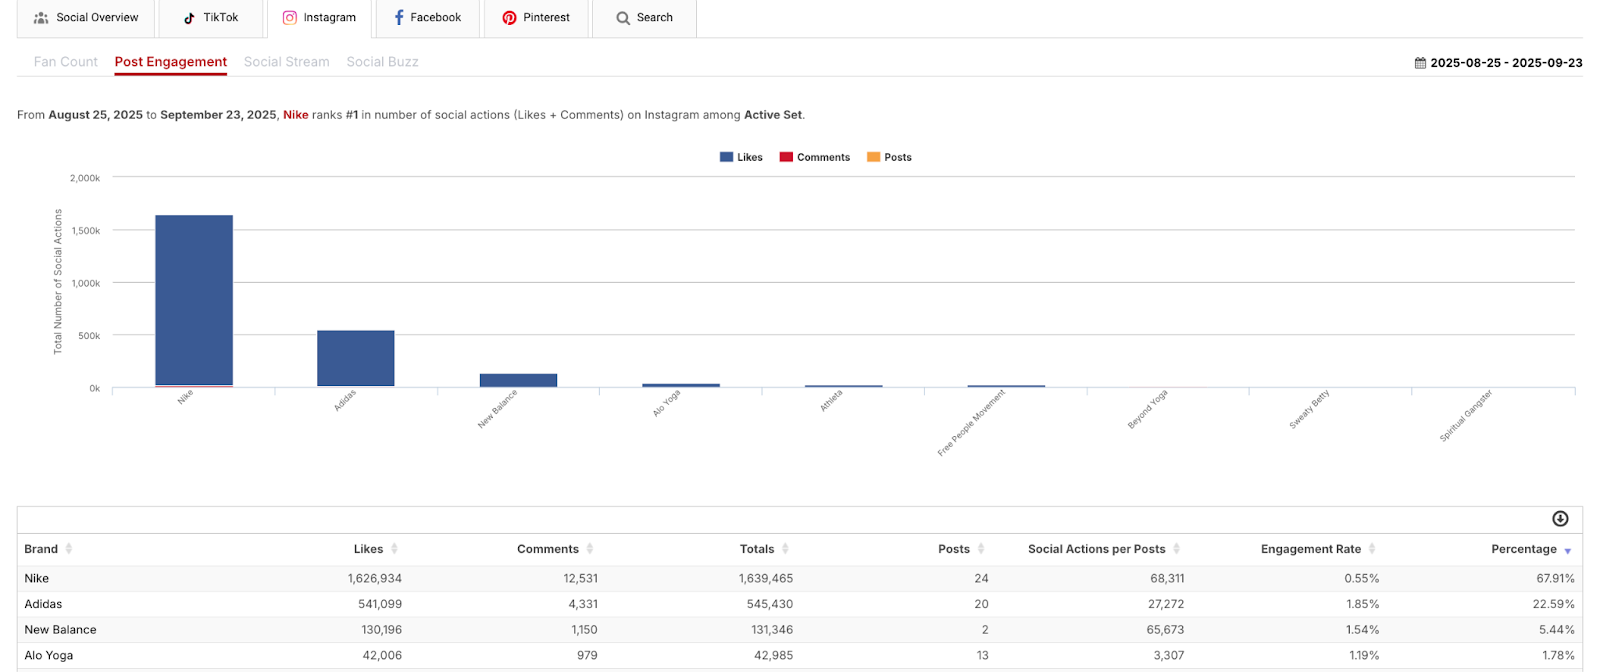
Post Engagement: total social actions across platforms within the selected time frame. This tab also breaks down Social Actions per Post and Engagement Rate, making it a useful way to understand which brand or influencer is generating stronger engagement with their followers.
-
Social Actions: aggregated likes, shares, comments, etc.
-
Social Actions per Post: aggregated social actions divided by total number of posts within the selected time frame
-
Engagement Rate: aggregated social actions divided by follower count
Social Stream: a stream of all posts created by the influencers or brands in your set. You can filter platform, post, and engagement metrics by popularity or date.
Social Buzz: aggregated post engagement from other Brands and Influencers mentioning the Brand or Influencer within the selected time frame
For deeper platform-level analysis, use the TikTok, Instagram, Facebook, and Pinterest tabs to view Fan Count through Social Buzz data for each platform individually.
On the 🔍 Search tab, you can view Search Growth and Search Volume metrics for these same brands and influencers, similar to how you would analyze trends in TrendPulse.

-
Note: When using this tab for influencers, search data may be low as people search for influencers more commonly on the social platforms directly, rather than Google.
2. You can also access BrandPulse by using the search bar in the top-right corner of the platform to look up one specific brand or influencer at a time.
Note: When you search for a brand or influencer, trends that include the name will appear first. Below those, you’ll see the Brands and any BrandPulse Sets that include that brand or influencer. From there, you can select the brand or influencer directly from the search results or click into one of the existing BrandPulse Sets to begin your analysis.
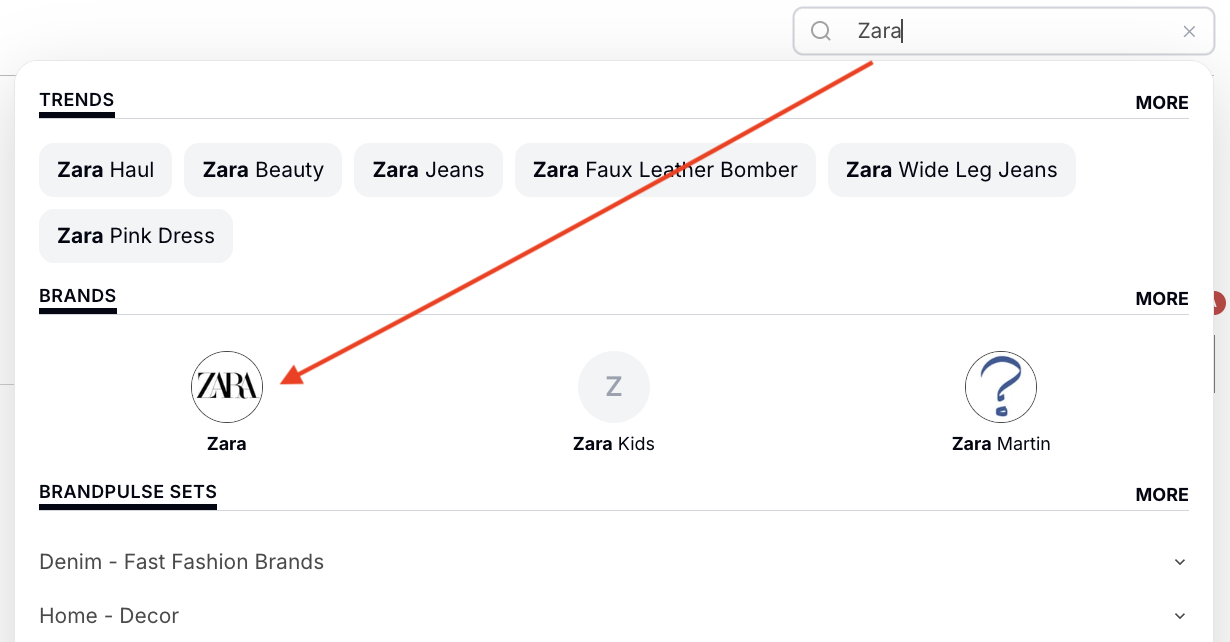
If you click on any brand or influencer name under “Brands”, you’ll be taken to its dedicated Brand Detail Page. This page breaks down the same metrics shown in a set, but focuses on a single brand or influencer for a deeper look.
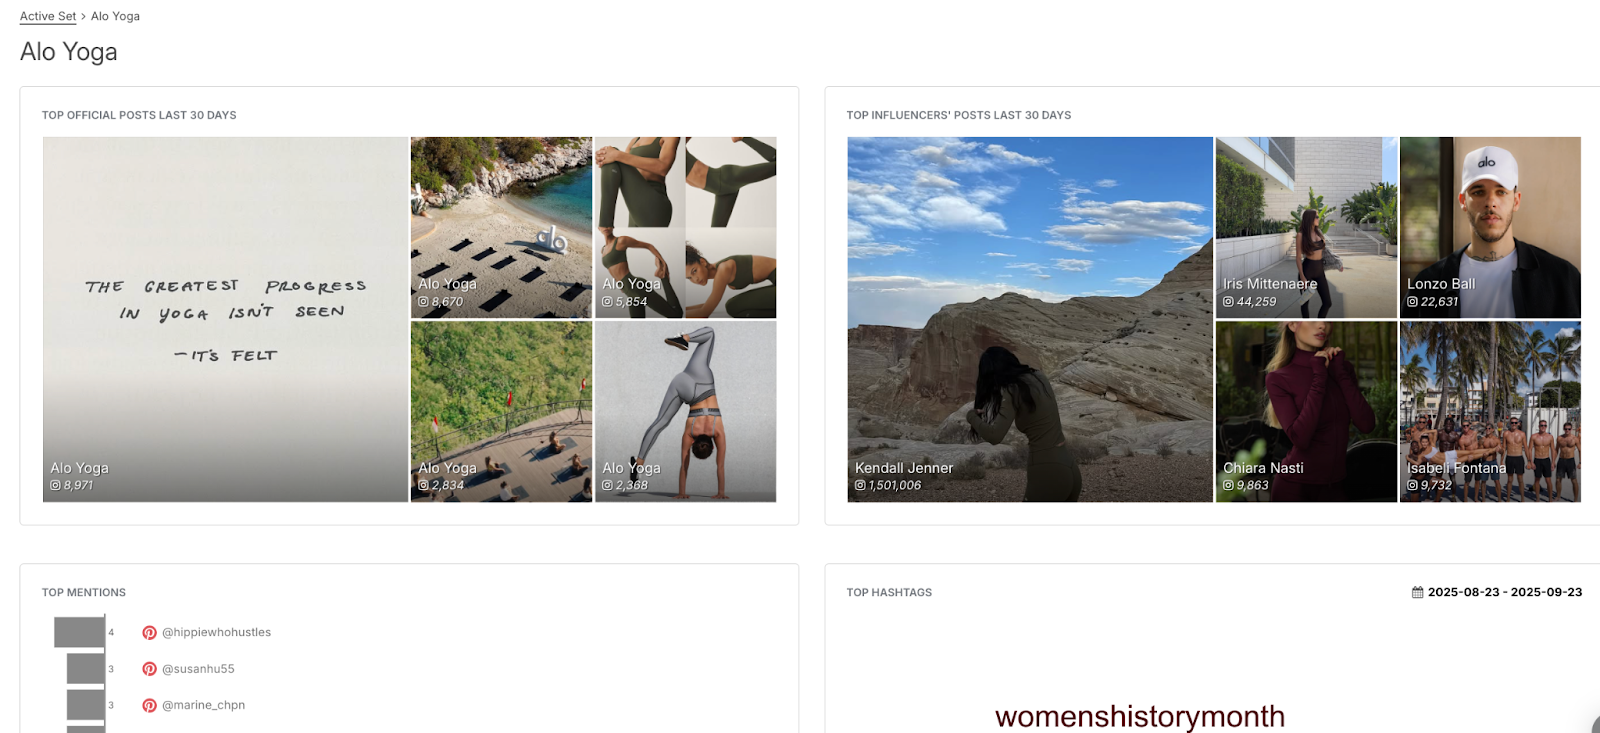
The Brand Detail Page shows the account’s top posts from the last 30 days, influencer posts mentioning the brand during that same period, top mentions, and top hashtags.
-
Note: you can change the date range at the top if you want to see the top posts over a certain period of time.
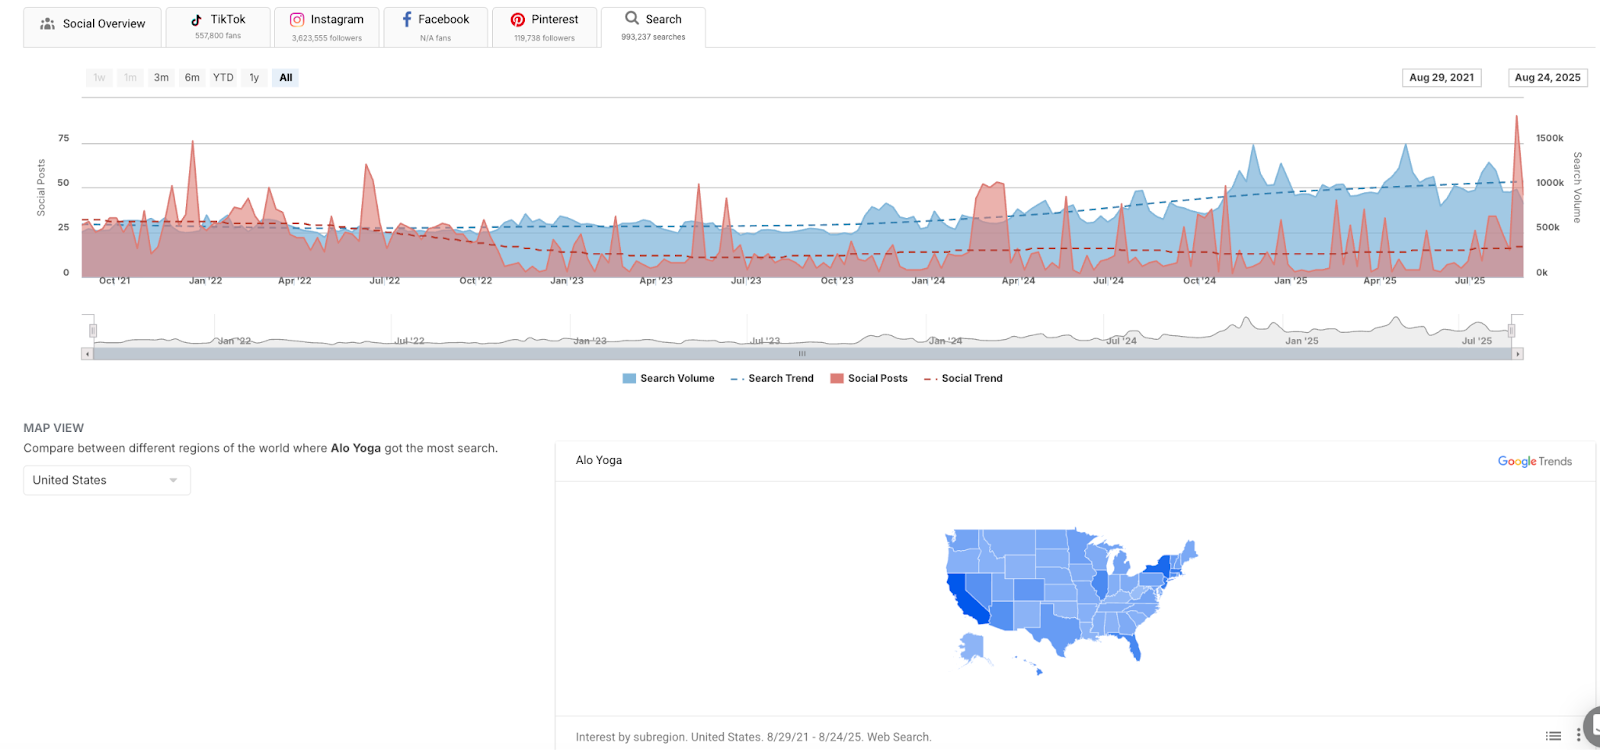
Here, you can also view how Google searches have changed over time, showing you the curve in relation to social posts as well. On the Search tab, the map below the search curve shows the brand’s search pattern by region. This regional data can help validate assortment strategies over time, and you can narrow the view by subregion, metropolitan area, or city for up to four years of history.
-
Note: to view search data as a stand alone - click on each icon at the bottom of the graph to remove it. By using the social tabs, you can break down a brand or influencer’s social media posts by account over time.
- Note: to change the date for the map, use the date range above the search curve.
At the bottom of the page, under Social Stream, you can view the account’s posts and mentions across all platforms, then drill down by social platform, date range, and sort order, such as social actions or post date.
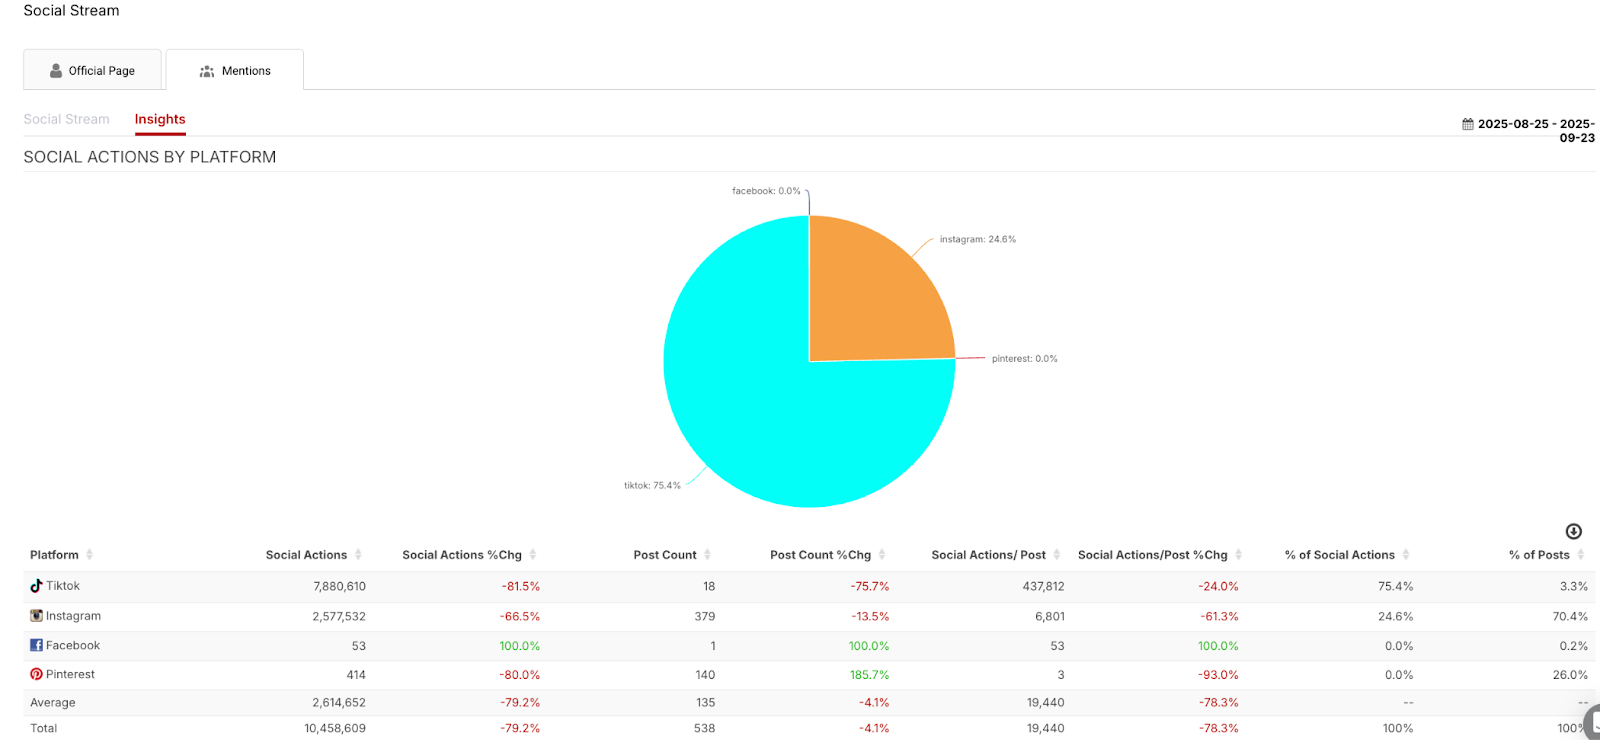
The Insights tab is available for both the brand or influencer’s own page and for mentions from other brands and influencers. It breaks down social actions by platform, giving you a more detailed view of post performance, engagement, and growth. This is especially helpful for understanding how a brand or influencer is performing across different social media platforms.
For an in-depth tutorial, be sure to reach out to your Customer Success Manager with any questions!